
Below are a collection of maps and statistics to help contextualize the country of Poland and the interviews collected there. The statistics presented are just a sample from the source Index Mundi, where many more can be found. As always, these statistics are subject to varying levels of accuracy due to collection methods, data reporting, and publishing date.
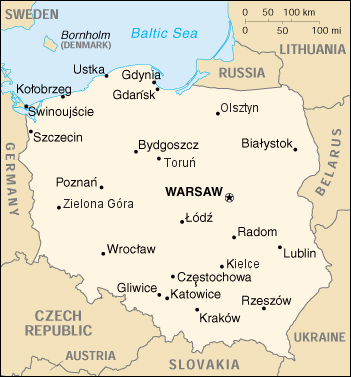
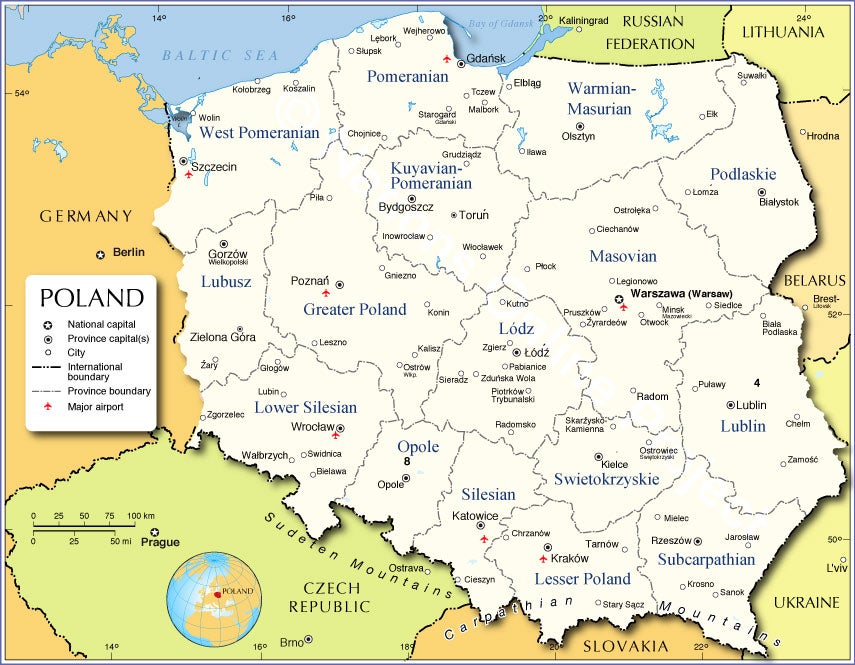

These maps and more can be found at the Nations Online Project and Wikimedia Commons.
Demographics
| Demographic Category | Specification | Country Site: Poland |
|---|---|---|
| Population | Total | 38,420,687 |
| Sex Ratio | 0.94 Male(s)/female | |
| Age Structure | 0-14 years: 14.8% (male 2,924,077 /female 2,762,634) 15-24 years: 10.34% (male 2,040,043 /female 1,932,009) 25-54 years: 43.44% (male 8,431,045 /female 8,260,124) 55-64 years: 13.95% (male 2,538,566 /female 2,819,544) 65 years and over: 17.47% (male 2,663,364 /female 4,049,281) | |
| Percentages of Major Ethnic Groups | Polish 96.9% Silesian 1.1% German 0.2% Ukrainian 0.1% Other and unspecified 1.7% | |
| Languages Spoken | Polish (official) 98.2% Silesian 1.4% Other 1.1% Unspecified 1.3% | |
| Income | Annual Income Per Capita | $29,600 |
| Gini Coefficient | 30.8 | |
| Educational Attainment | Overall | 16 Years |
| By Gender | Male: 16 years Female: 17 years | |
| Gainful Employment (Employment-to-population ratio) | Overall | 50.4 |
| By Gender | Men: 58.5 Women: 43.2 |
This map was prepared by Uyen Huynh, a mathematics and sociology undergraduate student at Bennington College for the Global Feminisms Project during the 2022-2023 academic year. (Last update: January 2023)
Sources: World Bank Open Data, World Health Organization

