seismic tomography
Model S40RTS [Ritsema J, Deuss A, van Heijst HJ, Woodhouse JH, Geophys. J. Int., 2011] and SP12RTS [Koelemeijer P, Ritsema J, Deus A, van Heijst HJ, Geophys. J. Int., 2015] are our most recently developed tomographic models of the mantle based Rayleigh wave dispersion, teleseismic body-wave Traveltime, and normal-mode Splitting function measurements. Utilities for plotting cross-sections and maps can be dowloaded from Paula Koelemeijer’s website. Shown on the right are shear-velocity variations in the uppermost and lowermost mantle according to S40RTS.
wave scattering in the mantle

Using global Seismic Network and USArray waveforms and AxiSEM software, we investigate scattering by small-scale heterogeneity in the lower mantle. In particular we use beam-forming techniques to locate scattering structures and to determine and their dimensions. We thermochemical convection simulations to understand the origin and the physical characteristics of wave scattering structures.
Shown on the left are simulations of 0.5 Hz P-wave scattering (PKP precursors) by fragments of basaltic rock that are distributed in the mantle after 4 billion years of ridge spreading and lithosphere recycling.
travel time perturbations by mantle plumes

Using SES3d (Fichtner et al. 2008) simulations, we investigate the expected waveform perturbations for hypothetical mantle structures such as plumes and slabs. We construct these geological structures by computer simulations of mantle convection and by relating temperature and compositional heterogeneity to wave speed variations using mineral physics constraints.
The example on the right shows (in panel c) the expected (frequency-dependent) traveltime delay of S waves propagating through the tail of a thermal plume in the lower mantle (panels a and b).
3D seismic image testing: wave reflections in the mantle

Using SPECFEM3D (Komatitsch et al. 2002) and our modifications of this software, we investigate the ray-theoretical interpretations of the travel times of seismic phases that are important in seismic tomography and mantle reflection seismology. The example on the left shows the expected variation in the S660S-S410S travel time (projected at the SS reflection points) due to shear wave speed heterogeneity according to mantle model S20RTS. The error in ray-theoretical prediction may be as high as 50%, especially at the shortest spatial scales. This implies that mapping of the depths of the 410-km and 660-km phase transitions is inaccurate if it is based on ray theory.
We apply similar analysis to the travel times and amplitudes of other long-period shear-wave phases such as multiple ScS reflections and receiver-side reverberations.
transition zone and uppermost lower mantle imaging
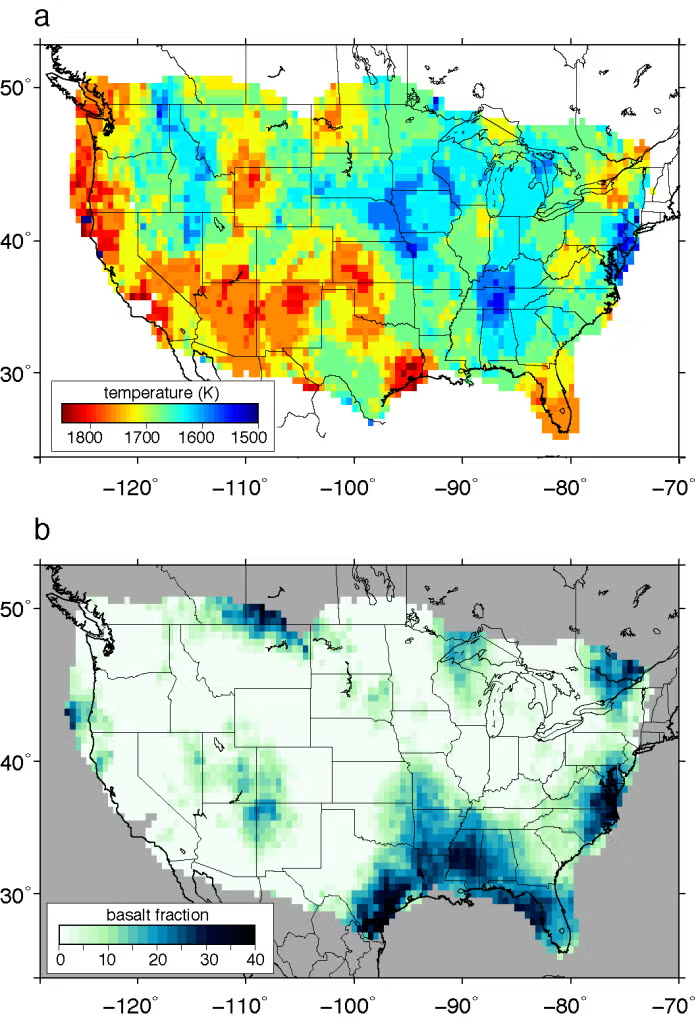
Using USArray waveform data, we have mapped P-to-S conversions at mineral discontinuities in the upper mantle transition zone beneath North America. The arrival times and amplitudes have been related to temperature and basalt fraction using experimental constraints on the relationships between wave speeds, mantle temperature and compositon.
The example on the right shows (in panel a) the potential temperature and (in panel b) the basalt fraction in the upper mantle transition zone based on the arrival times of P-to-S conversions at 410 km, 660 km, and 730 km depth.