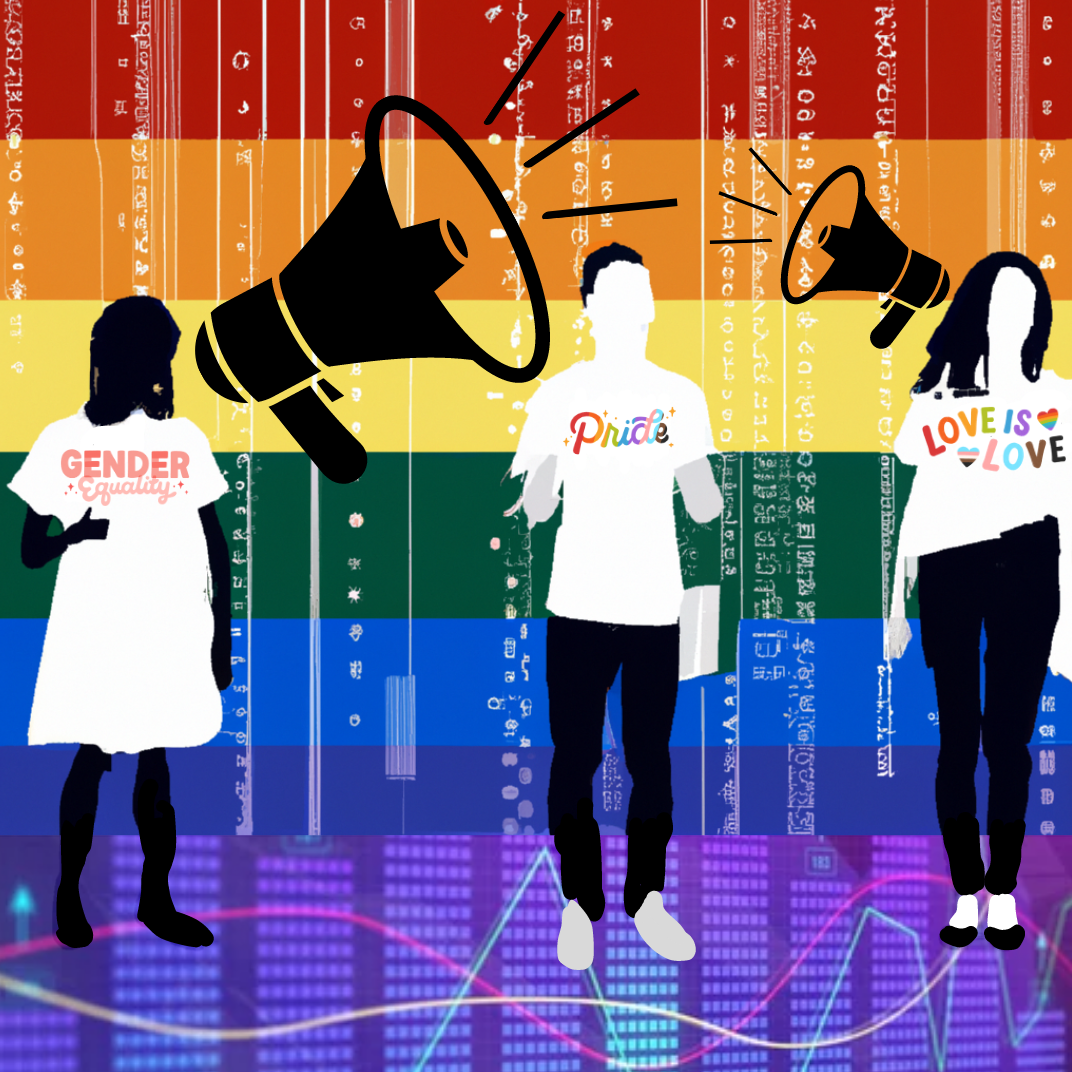
Image created with the help of DALL-E 2
Editor’s Note: This article uses the terms “LGBTQIA2S+” and “Queer” interchangeably to refer to the same community of people, as Michigan’s Spectrum Center does. QMSS acknowledges that terms like “Queer” have contentious histories and usages. These terms are absolutely not meant as a reflection of discrimination or negative feeling but to serve as a blanket term for a large, varied community. For more on this history, see this article.
Content Warning: this article links to discussions of homophobia and transphobia, including mentions of violence. Please be advised before following any links contained herein.
Written by Connor Zahler:
PRIDE MONTH, BY THE NUMBERS
On June 28, 1969, protests and demonstrations in support of gay liberation broke out following a police raid on the Stonewall Inn, a popular gay bar. One year later, Queer people around the country commemorated the events with even more demonstrations, and a tradition was born. Pride Month spread from New York City across the entire United States and, later, the entire world. In order to recognize Pride this year, we’ve done the only thing we know how to: connected it to data science and the social sciences. This article will highlight several initiatives and programs that uplift Queer voices in data science.
GAYTA SCIENCE
Founded in 2018 by data scientist Kelsey Campbell, Gayta Science is a website that both links to and produces its own initiatives that use data science to showcase the experiences of Queer people. Examples include “Plot Me Genderfluid,” a project that Campbell undertook to track and visualize their experience as a genderfluid person, and a Trans Day of Visibility project that raises awareness about the continuing violence that transgender (and other gender non-conforming) people face.
As a platform, Gayta Science is dedicated to using the tools that data science provides to shine a light on Queer experiences. It is also a free platform, performing and providing analyses that would typically be unavailable to those outside of academia. If you’re looking to grow your base of knowledge about LGBTQIA2S+ experiences, or need a golden example of the power of effective data science communication, Gayta Science is more than worth your time.
QUEER IN AI
The potential for AI to be affected by—and even entrench—biases has been well-documented, and homophobia and transphobia are no different. To combat this possibility, and ensure that AI remains accessible and useful for Queer people, a group of researchers formed Queer in AI. Queer in AI provides services ranging from bias-focused workshops to financial aid for Queer individuals applying to graduate school. They regularly hold events organized in-house and meetups at larger conferences.
Queer in AI has been inspired by, and remains connected with, similar initiatives like Black in AI and Latinx in AI. It is also part of oSTEM, a network of Queer-focused organizations in STEM fields. If you’re a current or future graduate student interested in Queer issues, or just looking for a fun meetup at a conference, Queer in AI will definitely be of interest to you.
QUEERNESS AND GIS
Frequent readers will know that GIS is one of my hobby horses, so I’d be remiss not to mention some initiatives that highlight LGBTQIA2S+ history and culture.
This article opened with a link to the New York Bureau of Land Management’s “50 Years of Pride.” It uses historical photographs, illustrations, and mapping to tell the story of New York’s Queer community. There’s also a map that lays out New York’s 2020 Pride route and provides information about the significance of each stop and turn. Not only does it provide a lot of information, it also looks fantastic.
ESRI, the company behind GIS, has taken an active role in encouraging an exploration of Queer topics. In 2021, they made data from a major household survey about sexual orientation and gender identity available as part of their Living Atlas. By itself, it shows the prevalence of Queer identities across the United States. It can also be used as a layer in user-generated maps, allowing empowering users to perform their own analyses.
For our most academic readers, we would be remiss not to mention Michael Brown and Larry Knopp’s seminal “Queering the Map.” Published in a 2008 edition of the Annals of the Association of American Geographers, this article draws on the authors’ own experiences as Queer geographers and paints a picture of the history of Queer geography as a concept. Although the authors acknowledge major tensions, they also point to their own productive uses of GIS and call for more Queer researchers to draw on it. This article is an essential read for anyone interested in the intersection of Queerness and mapping.
FURTHER RESOURCES AND READING
For our Michigan readers, there really is no better source than the Spectrum Center. Whether it be organizing events, providing support, or creating educational workshops, almost every Queer initiative on campus runs through the Spectrum Center. Their website is a goldmine for information.
This article is part of a wider series meant to acknowledge and celebrate marginalized communities in the field of data science. Readers may be interested in these articles on women in data science.

