

Publications

Wolf YI, Arshad K, Kannatey-Asibu K, Theisen RQ, Kitzinger KA, Jain PV, Koonin EK*, Makarova KS*, Ledvina HE* (2026) bioRxiv https://doi.org/10.64898/2026.11.03.763955
*co-corresponding authors

The Panoptes system uses decoy cyclic nucleotides to defend against phage
Sullivan AE, Nabhani A, Izrailevsky DS, Schinkel K, Hoffman CRK, Robbins LK, Nagy TA, Duncan ML, Ledvina HE, Erbse AH, Kibby EM, Tak U, Dinh DM, Ednacot EMQ, Ngyuen CM, Burroughs AM, Aravind L, Whiteley AT, Morehouse BRT (2025) Nature https://doi.org/10.1038/s41586-025-09557-z
Feature in: Nature Bacteria use a decoy defence molecule to set a trap for viruses (2026)

Curli-independent defense against Bdellovibrio bacteriovorus in E. coli
Sayegh R, Ledvina HE, Whiteley AT (2025) mSpectrum https://doi.org/10.1128/spectrum.00342-25

Functional amyloid proteins confer defense against predatory bacteria
Ledvina HE, Sayegh R, Carale RO, Azadeh AL, Macklin AR, Whiteley AT (2025) Nature https://doi.org/10.1038/s41586-025-09204-7
Featured in: Nature Reviews Microbiology “Body armour keeps predators away” (2025)

A eukaryotic-like ubiquitination system in bacterial antiviral defence
Chambers LR, Ye Q, Cai J, Gong M, Ledvina HE, Zhou H, Whiteley AT, Suhandynata RT, Corbett KD (2024) Nature https://doi.org/10.1038/s41586-024-07730-4

Conservation and similarity of bacterial and eukaryotic innate immunity
Ledvina HE, Whiteley AT (2024) Nature Reviews Microbiology https://doi.org/10.1038/s41579-024-01017-1

Discovery of a unique pathway for glutathione utilization in Francisella
Wang Y, Ledvina HE, Tower CA, Kambarev S, Liu E, Charity JC, Lieselotte S.M.S., Chen E, Gallagher LA, Radey MC, Rerolle GE, Li Y, Penewit KM, Turkarslan S, Skerrett SJ, Salipante SJ, Beliga NS, Woodward JJ, Dove SL, Peterson SB, Celli J, Mougous JD (2023) Cell Host Microbe https://doi.org/10.1016/j.chom.2023.06.010
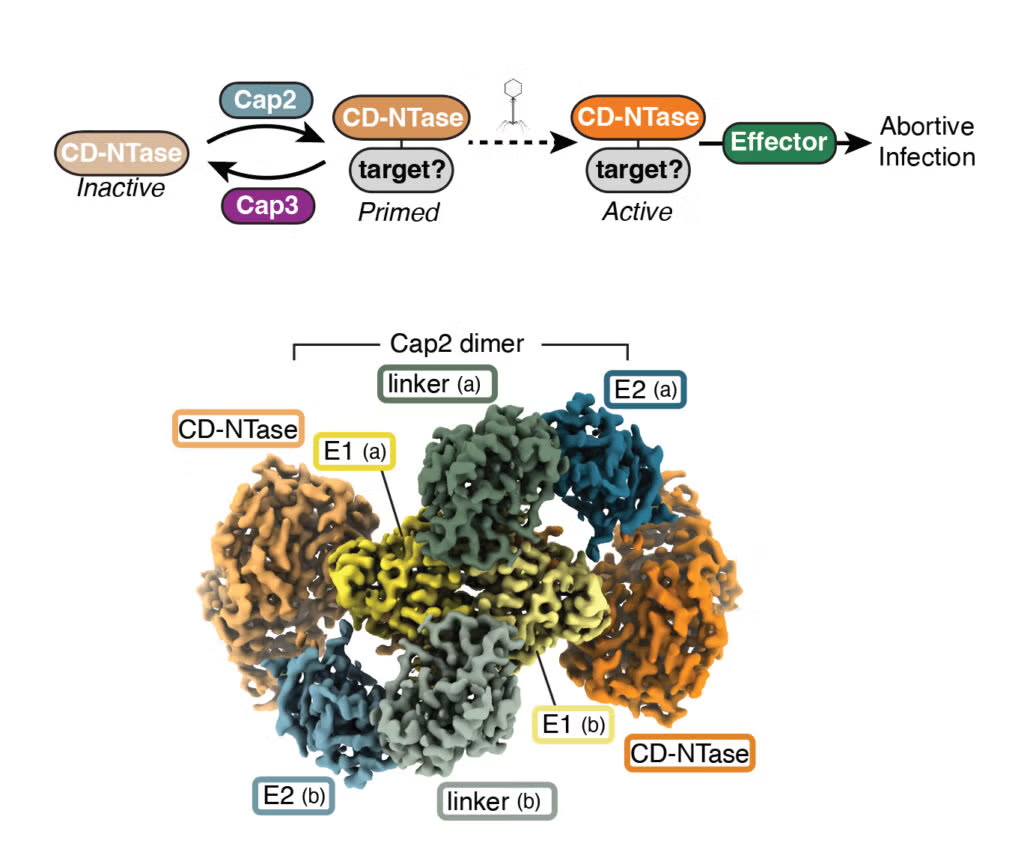
A E1-E2 fusion protein primes antiviral immune signaling in bacteria
Ledvina HE*, Ye Q*, Gu Y, Quan Y, Sullivan AE, Lau RK, Zhou H, Corbett KD, Whiteley AT(2023) Nature *Authors contributed equally to this work https://doi.org/10.1038/s41586-022-05647-4

Ting SY, LaCourse KD, Ledvina HE, Zhang R, Radey MC, Kulasekara HD, Somavanshi R, Bertolly SK, Gallagher LA, Kim J, Penewit KM, Salipante SJ, Xu L, Peterson SB, Mougous JD (2022) eLife https://doi.org/10.7554/eLife.74658

An internal DNA deaminase toxin directly mutagenizes surviving target populations
de Moraes M, Hsu FS, Huang D, Bosch DE, Zheng J, Radey MC, Simon N, Ledvina HE, Frick JP, Wiggins PA, Peterson SB, Mougous JD (2021) eLife https://doi.org/10.7554/eLife.62967

Ramsey KM*, Ledvina HE*, Tresko TM, Wandzilak JM, Tower CA, Tallo T, Schramm CE, Peterson SB, Skerrett SJ, Mougous JD, Dove SL (2020) PLoS Pathogens *Authors contributed equally to this work https://doi.org/10.1371/journal.ppat.1008566
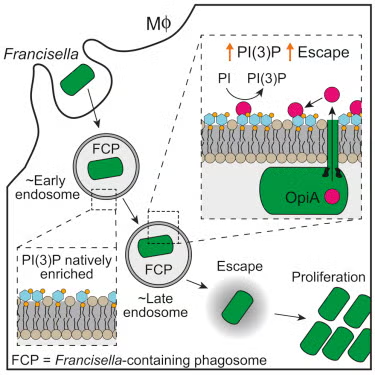
Ledvina HE, Kelly KA, Eshraghi A, Plemel RL, Peterson SB, Lee B, Steele S, Adler M, Kawula TH, Merz AJ, Skerrett SJ, Celli J, Mougous JD (2018) Cell Host Microbe https://doi.org/10.1016/j.chom.2018.07.003
Featured in: Cell Host and Microbe “Bacterial Prison Break: A Host Protein Mimic Paves the Way” (2018)
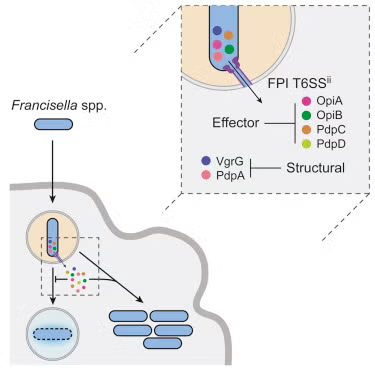
Eshraghi A, Kim J, Walls AC, Ledvina HE, Miller CN, Ramsey KM, Whitney JC, Radey MC, Peterson SB, Ruhland BR, Tran BQ, Goo YA, Goodlett DR, Dove SL, Celli J, Veesler D, Mougous JD (2016) Cell Host Microbe https://doi.org/10.1016/j.chom.2016.10.008
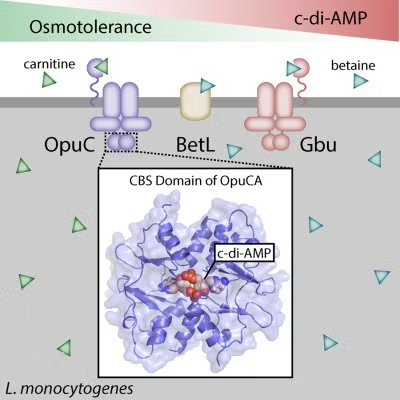
Cyclic di-AMP targets the cystathionine beta-synthase domain of the osmolyte transporter OpuC
Huynh TN, Choi PH, Sureka K, Ledvina HE, Campillo J, Tong L, Woodward JJ (2016) Molecular Microbiology https://doi.org/10.1111/mmi.13456

Distinct Innate Responses are Induced by Attenuated Salmonella enterica serovar Typhimurium Mutants
Powell DA, Lydia RM, Ledvina HE, Sempowski GD, Curtiss R, Frelinger JA (2015) Cellular Immunology https://doi.org/10.1016/j.cellimm.2015.10.002
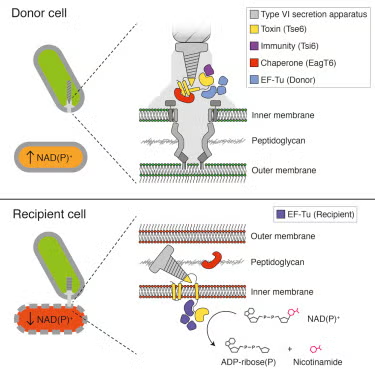
Whitney JC, Quentin D, Sawai S, LeRoux M, Harding BN, Ledvina HE, Tran BQ, Robinson H, Goo YA, Goodlett DR, Rausner S, Mougous JD (2015) Cell https://doi.org/10.1016/j.cell.2015.09.027

Jennings LK, Storek KM, Ledvina HE, Coulon C, Marmont LS, Sadovskaya I, Secor PR, Tseng BS, Scian M, Filloux A, Wozniak DJ, Howell PL, Parsek MR (2015) PNAS https://doi.org/10.1073/pnas.1503058112
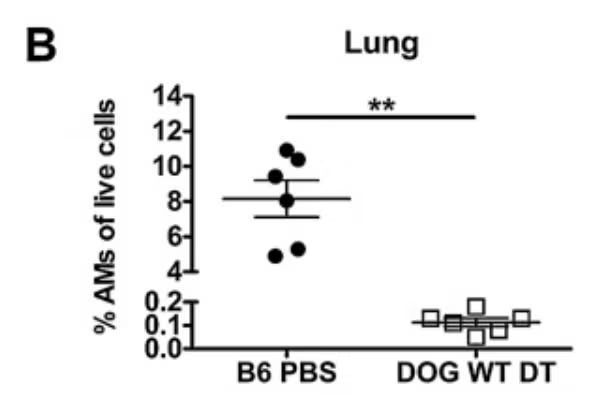
Roberts LM, Ledvina HE, Tyladhar S, Jamwal D, Steele SP, Sempowski GD, Frelinger JA (2015) Immunity Inflammation and Disease https://doi.org/10.1002/iid3.51

Wilbur JS, Byrd W, Ramamurthy S, Ledvina HE, Khirfan K, Riggs MW, Boedeker EC, Vedantam G, Viswanathan VK (2015) Infection and Immunity https://doi.org/10.1128/IAI.02876-14
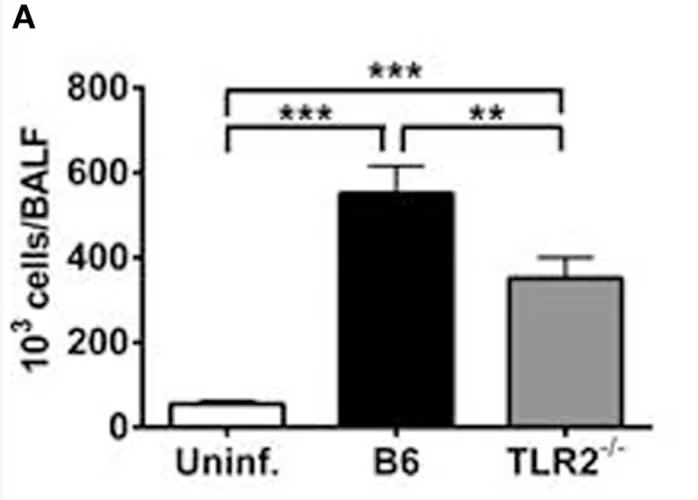
TLR2 Signaling is Required for the Innate, but Not Adaptive Response to LVS clpB
Roberts LM, Ledvina HE, Sempowski GD, Frelinger JA (2014) Frontiers in Immunology https://doi.org/10.3389/fimmu.2014.00426
For the most recent full list of publications see here.
The Ledvina Lab
University of Michigan MCDB Department Biological Sciences Building Ann Arbor, Michigan

Proudly powered by WordPress