
Keynote Speaker
Robert Penn Guralnick
Mapping life: challenges with overcoming the Wallacean shortfall and documenting global scale biodiversity change
 Biodiversity is in crisis with the predicted loss of genetic and species diversity as great as past mass extinction events. A pressing challenge in environmental sciences will be to understand the factors affecting this decline. One of the first steps towards meeting this challenge will be to document global patterns of biodiversity and note how those patterns change over time and space. In the race against biodiversity loss, this daunting task may seem too difficult especially since data about biodiversity has been scattered in different formats in different digital repositories, natural history collections, survey reports, and the literature. A grand challenge is the creation of a linked system of all biodiversity data, information and knowledge organized around two key conceptual frameworks: Darwin’s ever-growing Tree of Life and a Map of Life that integrates our knowledge about species distributions and biogeography. The emerging and integrative field of biodiversity informatics is poised to meet these challenges.
The framework for the great Tree of Life infrastructure is one that needs to accommodate topological disagreement and where necessary, consolidate taxon names, phenotypic and geographical distributional data across clades, all served as an integrated community resource. The vision for a Map of Life is to overcome the Wallacean shortfall, where spatial distribution of species is orders of magnitude coarser in resolution than other geographically structured environmental datasets such as topography or land cover. I will, in particular, focus on describing the Map of Life project, a conceptual and cyber-infrastructure framework for refining species distributional knowledge that is novel in its ability to mobilize and integrate diverse forms types of data such that their collective strengths of different data types overcome individual weaknesses. The ultimate aim for both the Tree of Life and Map of Life are public, online, quality-vetted, growing and linked repositories that are owned by, and added to, by the community. I close by discussing new opportunities and challenges developing such community-owned resources and their potential impact on ecology and evolutionary biology.
Jessica L. Blois
Climate controls on temporal variation in beta diversity
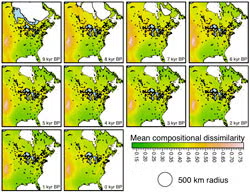 Models of beta diversity are important tools for predicting the spatial patterns of biodiversity and community turnover along environmental gradients. Generalized dissimilarity modeling (GDM) is a form of beta-diversity modeling that has been applied to predict the distributions of species and communities, identify survey gaps, set conservation priorities, and assess climate-change impacts. Late-Quaternary paleo-records, with their strong signals of community turnover, environmental change, and no-analog community formation, offer a natural opportunity to test GDM and other beta-diversity models. Here, I couple fossil-pollen data in eastern North America from the Neotoma paleoecology database with downscaled CCSM3 transient paleoclimate simulations since the Last Glacial Maximum to test the role of climate in controlling past community turnover. Specifically, I determine whether the emergent rates of community dissimilarity along spatial environmental gradients were constant over the 21,000 years, how well models for one time period (e.g. 14 ka) predict spatial dissimilarity between communities at all other time periods (e.g., 13 ka, 12 ka, etc), and whether predictive ability correlates with the magnitude of climate change.
Image: Jessica Blois
Ana Carolina Carnaval
Understanding diversity patterns in the Brazilian coastal forests: Bayesian computation meets correlative models and evolutionary physiology
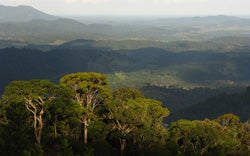 My lab employs the tools of bioinformatics to guide biodiversity research in the South American tropics. In studies of the Brazilian Atlantic forest and its endemic frogs, I have used correlative models of species and habitat distributions under current and paleoclimates to guide Hierarchical Approximate Bayesian Computation models of historical demography. Such combination of tools validated a hypothesis-testing framework to the study of the historical processes responsible for the spatial re-shuffling of genetic diversity in coastal Brazil during the Last Glacial Maximum and the Holocene. As we are now furthering our paleoclimatic studies and gathering phylogeographical data from species restricted to higher elevations, we realize the need to refine available forest models as to fully capture the history of the biome and identify distinct types of shifting forest refugia through time. In this talk, I present and discuss these results. When analyzed jointly, these new environmental analyses and molecular data from amphibians and reptiles point to the central role of species’ physiological constrains in shaping biological responses to Late Quaternary climate change, hence defining current diversity patterns in the tropics.
Image: Brazilian rainforest by Mauro Teixeira Jr.
Andrew Hill
Biodiversity informatics: strengthening the ties between science and the community
 Sharing, understanding, and communicating data are the fundamental responsibilities of biodiversity informatics. Yet more and more, enthusiasts are contributing substantial efforts toward advances in what were traditionally specialized domains. Examples of this shift can be seen everywhere from the rapidly growing citizen science movement to the increasing impact being made through data journalism. In particular, projects like Planet Hunters have helped to prove that relatively untrained members of the public can be trained quickly and then relied upon to contribute high quality scientific data. Newer projects, such as NEEMO and the upcoming biological data transcription project ‘Notes from Nature’, are demonstrating how citizen science projects can be designed to enhance data and information creation and sharing in the biological sciences. In the case of NEEMO, we worked with NASA to design and implement a platform for volunteers to use geospatial image mark-up to help catalog seafloor biodiversity. In Notes from Nature, we conceived a project where biodiversity records could be liberated from museum collections by a volunteer army transcribing hand written labels. The project has already grown to become a collaborative effort across several institutions. The resulting biodiversity data projects like NEEMO and Notes from Nature create will help answer pressing questions in biodiversity sciences from taxonomy to global change ecology. Still, citizen science for generating biodiversity occurrence and observation data is not the creative limit of our community; we need to start thinking of new ways to share original data that encourage greater use from outside our community. We can leverage a new group of enthusiasts, those interested in data analysis, data visualization, and data journalism to help drive greater awareness, improve reporting, and provide oversight related to biodiversity and biodiversity loss. The future of biodiversity informatics will be marked by our ability to welcome these outside communities into the biodiversity research domains. It is their ideas and passion that will lead us to our greatest discoveries.
Image: The NEEMO mission tool for joining volunteers and NASA scientists to collaboratively mark up the seafloor, by Vizzuality and NASA
Monica Papeş
The role of museum and herbaria specimens in predicting present and future potential distributions of species
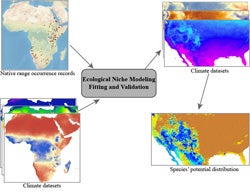 In recent years, international efforts to improve natural history museum specimen data access through information digitization and networking of distributed databases have made possible query and retrieval of biodiversity information at unprecedented scales. In conjunction with and stimulated by this advancement, various open source tools for analyzing biodiversity data have been developed. The ecological niche modeling methodology that correlates species’ occurrence data with geospatial environmental variables has generated a profusion of research topics and is subject to vigorous investigation and development. Three major topics of biodiversity change studies that make use of ecological niche modeling and digitized museum specimen information will be illustrated: climate change, biological invasion, and conservation biology. The examples will be discussed in light of recent advances in the field as well as current limitations and potential pitfalls. Recommendations, possible solutions and future directions in the field will be presented in closing remarks.
Dan F. Rosauer
Toward a predictive model of phylogenetic beta diversity
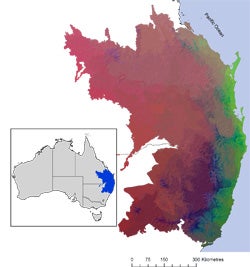 I will present phylogenetic generalized dissimilarity modeling, a new technique to model the spatial structure of phylogenetic beta diversity. I will evaluate its performance and illustrate its application to conservation planning and biological regionalisation. Generalized dissimilarity modeling (GDM) uses environmental data to model of turnover in the species composition of communities. Here we extend GDM to interpolate the spatial structure of phylogenetic beta‐diversity (phylo‐GDM) between and beyond sampled sites. We generated phylo‐GDM models for Australia’s largest frog radiation using museum records for 114 Australian myobatrachid frog species, linked to an mtDNA phylogeny. We found that phylo‐GDM gives a stronger statistical model of compositional turnover than species GDM, but this depends on the age of the phylogenetic relationships used in the model. We therefore tested the fit of GDM models for different ages within the phylogeny to find the phylogenetic tree depth at which the relationship to current day environment is greatest. Phylo‐GDM has considerable potential as a method for including phylogenetic relationships in spatial biodiversity analyses for conservation planning and global change assessments. Because phylogenies do not require named taxa, phylo‐GDM also provides a means of bringing lineages with poorly resolved taxonomy into biodiversity planning and phylogeographic analysis.
Image: Modeled pattern of phylogenetic ß diversity for Myobatrachid frogs in Eastern Australia. Similar colors indicate more closely related species.
Lauren Sallan
After the end: how the end-Devonian extinction shaped vertebrate biodiversity 
Most biodiversity studies focus on a geologically random snapshot (the Recent), often unrepresentative of larger trends and silent on faunal origins. The fossil record provides unique database containing the evolutionary histories of modern lineages and past biotas, illustrating both change and convergence. Modern vertebrate faunas are dominated by ray-finned fishes, tetrapods, and sharks. However, biotas at the origin of tetrapods were defined by now-extinct or depauperate groups such as lobe-finned fishes (lungfish and coelacanths). To investigate the origins of modern biodiversity, I constructed a global database for early vertebrate diversity covering a 70-million-year interval. To detect biotic change, I applied analyses of faunal composition from community ecology to a temporally arranged set of fossil assemblages. This revealed the end-Devonian extinction (360 million years ago) as a critical event in vertebrate evolution. Global vertebrate faunas were destroyed and 44% of major clades lost, permitting the rise of the modern vertebrate biota from scarce survivors. Analyses of fossil morphologies (geometric morphometrics and phylogenetic comparative methods) showed that survivors did not converge on lost ecomorphs, but rather evolved novel trophic strategies in the face of available opportunity. Comparison with invertebrate diversity databases revealed resultant trophic cascades over geological timescales, restructuring aquatic ecosystems.
Image: Reconstruction of a Carboniferous marine ecosystem, painting by Bob Nicholls
Morgan W. Tingley
Understanding the future through unlocking the past: historical data and climate change inference
 A general lack of long-term distributional data continues to be a stumbling block in our ability to detect, track, and predict range shifts in response to ongoing environmental change. Historical data derived from museums, field notes, and other archived sources provide past occurrences, yet comparisons between historic and contemporary data may yield biased inferences on how species respond to climate change unless detectability and mismatched methodologies are taken into account. Statistical techniques, such as occupancy models, can unlock the potential in historical occurrence data, as demonstrated by the evaluation of range shifts and community changes for the bird community of the Sierra Nevada in California over the last 100 years. This analysis of changes over a century reveals high heterogeneity in species’ movements relating strongly to both temperature and precipitation changes over the same time period. From a community perspective, site-level species diversity has generally decreased over the last century, particularly due to richness declines at elevational extremes. Altogether, this analysis of historical occurrence data provides strong evidence of how climate change has already begun affecting bird ranges and communities with important implications for the future.
Image: Morgan Tingle
Zhiheng Wangwang
Large-scale patterns of woody plant diversity in China: climatic and evolutionary determinants
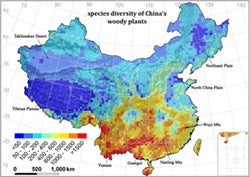 How contemporary environment and evolution determine large-scale patterns of species richness is a fundamental yet controversial question of biology. Integrating ecological with macroevolutionary methods helps understanding the mechanisms. With a rich flora, broad environmental/geological gradients, China provides a “natural lab” for testing the mechanisms of species richness patterns. Here, we compiled the distribution maps of 11,405 woody species in China, and, in combination with the current phylogeny of angiosperms, we 1) evaluated the effects of contemporary climate, particularly environmental energy, water–energy dynamics and winter coldness, 2) analyzed how biogeographical affinities (tropical vs. temperate) influence richness-climate relationships, and 3) explored the phylogenetic structures in species richness patterns. We found that species richness patterns were more strongly correlated with the richness of tropical-affinity species than with that of temperate-affinity species. The mean root distance of woody species decreased towards the north, and was negatively correlated with species richness. Mean winter temperature was the strongest predictor of species richness, and its explanatory power was significantly higher for tropical-affinity species than temperate-affinity species. These results suggest that the patterns of woody species richness are mainly resulted from the increasing intensity of winter coldness from the equator to the poles, and hence support the freezing tolerance hypothesis.