
Below are a collection of maps and statistics to help contextualize the country of Japan and the interviews collected there. The statistics presented are just a sample from the source Index Mundi, where many more can be found. As always, these statistics are subject to varying levels of accuracy due to collection methods, data reporting, and publishing date.
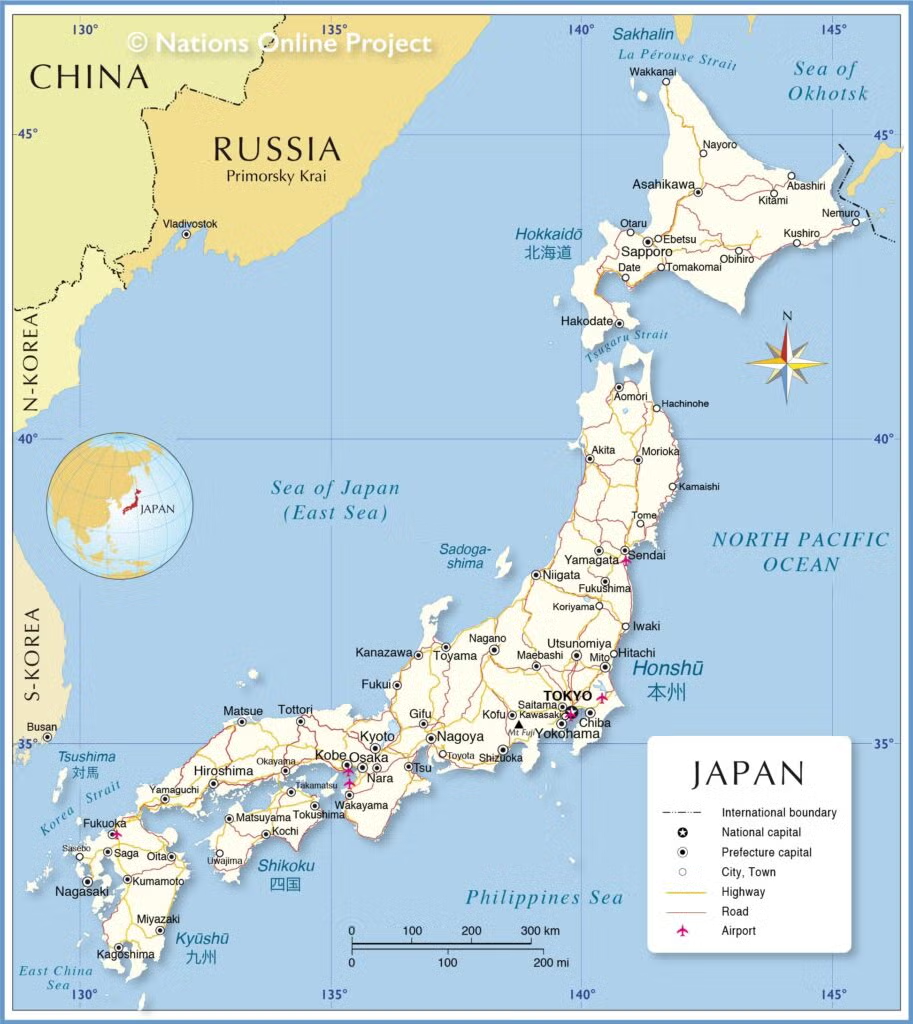

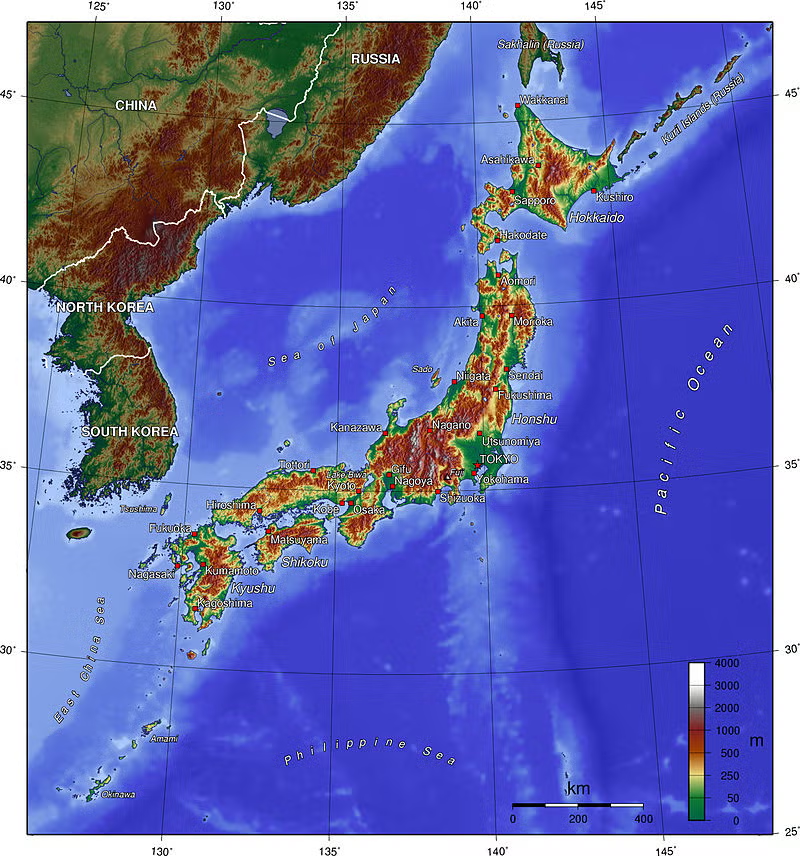
These maps and more can be found at the Nations Online Project and Wikimedia Commons.
Demographics
| Demographic Category | Specification | Country Site: Japan |
|---|---|---|
| Population | Total | 125,507,472 |
| Sex Ratio | 0.939 male(s)/female | |
| Age Structure | 0-14 years: 12.49% (male 8,047,183/female 7,623,767) 15-24 years: 9.47% (male 6,254,352/female 5,635,377) 25-54 years: 36.8% (male 22,867,385/female 23,317,140) 55-64 years: 12.06% (male 7,564,067/female 7,570,732) 65 years and over: 29.18% (male 16,034,973/female 20,592,496) | |
| Percentages of Major Ethnic Groups | Japanese 98.1% Chinese 0.5% Korean 0.4% other 1% (Filipino, Vietnamese, and Brazilian) | |
| Income | GDP per capita (PPP) | $42,900 |
| Educational Attainment | Overall | 15 years |
| By Gender | Male: 15 years Female: 15 years | |
| Gainful Employment (Employment-to-Population Ratio) | Overall | 56.8 |
| By Gender | Men: 68.2 Women: 46.2 |
